Mejora tu proceso de toma de decisiones con informes de datos visuales y entendibles. Nuestros gráficos transforman la información compleja en elementos visuales fáciles de entender, guiándote hacia decisiones más inteligentes e informadas. Configúralos como desees.
¿Cómo puede Analytics ayudar a tu empresa?
Acceso a los datos simplificado
Accede sin esfuerzo a cualquier dato sin necesidad de navegar por complejas herramientas de Business Intelligence. Analytics te permite aprovechar todo el potencial de tus datos y extraer información valiosa con facilidad.
Destaca información relevante
Crea dashboards que funcionen en tiempo real y compártelos sin problemas con tu equipo. Analytics te ayuda a crear presentaciones visuales dinámicas que proporcionan información actualizada al minuto, lo que permite a tu equipo mantenerse informado y tomar decisiones ágiles.
Controla el acceso
Toma las riendas del acceso a datos confidenciales con nuestro sistema de gobernanza de datos, garantizando la seguridad de los mismos. Decide qué personas o equipos pueden acceder y protege tus datos a todos los niveles.
Aprende sobre las herramientas que componen Analytics
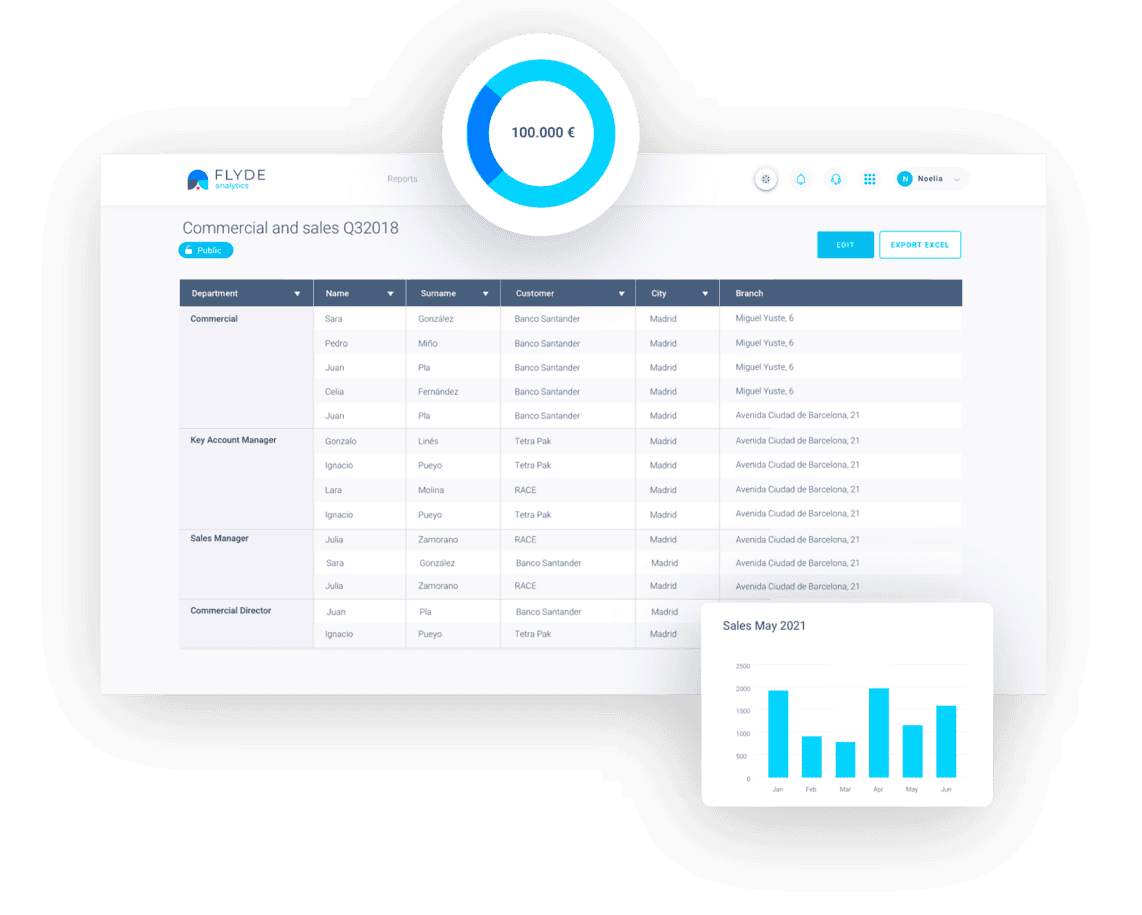
Informes
Crea informes a partir de conjuntos de datos, agrúpalos, fíltralos y preséntalos en un formato visualmente atractivo.
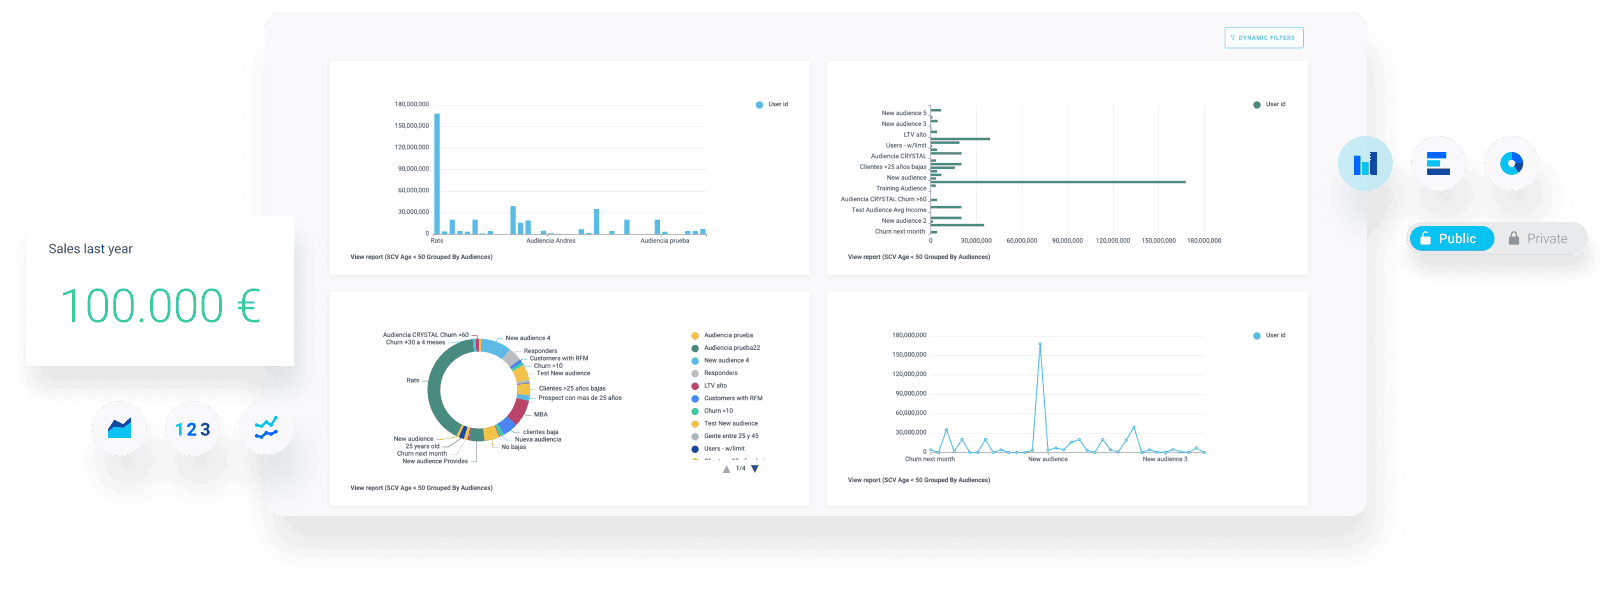
Dashboards
Transforma tus informes en atractivos dashboards. También puedes acceder a ellos desde tu dispositivo móvil para llevarlos donde los necesites.
Gobernanza
Define quién puede acceder a los informes o dashboards de forma individual. Todos tus datos están siempre protegidos.
Filtros dinámicos
Navegar por grandes cantidades de datos es mucho más fácil con nuestros filtros dinámicos. Segmenta de forma inmediata según los criterios que más te interesan y afina tus resultados.
Explota los resultadosen el resto de apps
Una vez procesados los datos, combina Analytics con el resto de aplicaciones para sacarles el máximo partido. Dispones de cuatro apps más orientadas a optimizar las estrategias de usuario. Comprueba las ventas, predice tendencias u obtén un perfil completo y real de tus usuarios, entre otras muchas cosas.
Una vez procesados los datos, combina Trends con el resto de aplicaciones para sacarles el máximo partido. Dispones de cuatro apps más orientadas a optimizar las estrategias de usuario. Comprueba las ventas, predice tendencias u obtén un perfil completo y real de tus usuarios, entre otras muchas cosas.